Health Industry
Introduction
In healthcare, my projects use data to support patient care, simplify processes, and help healthcare teams make better decisions. I aim to drive improvements that benefit both patients and providers.
Analysis of US Health Insurance Coverage
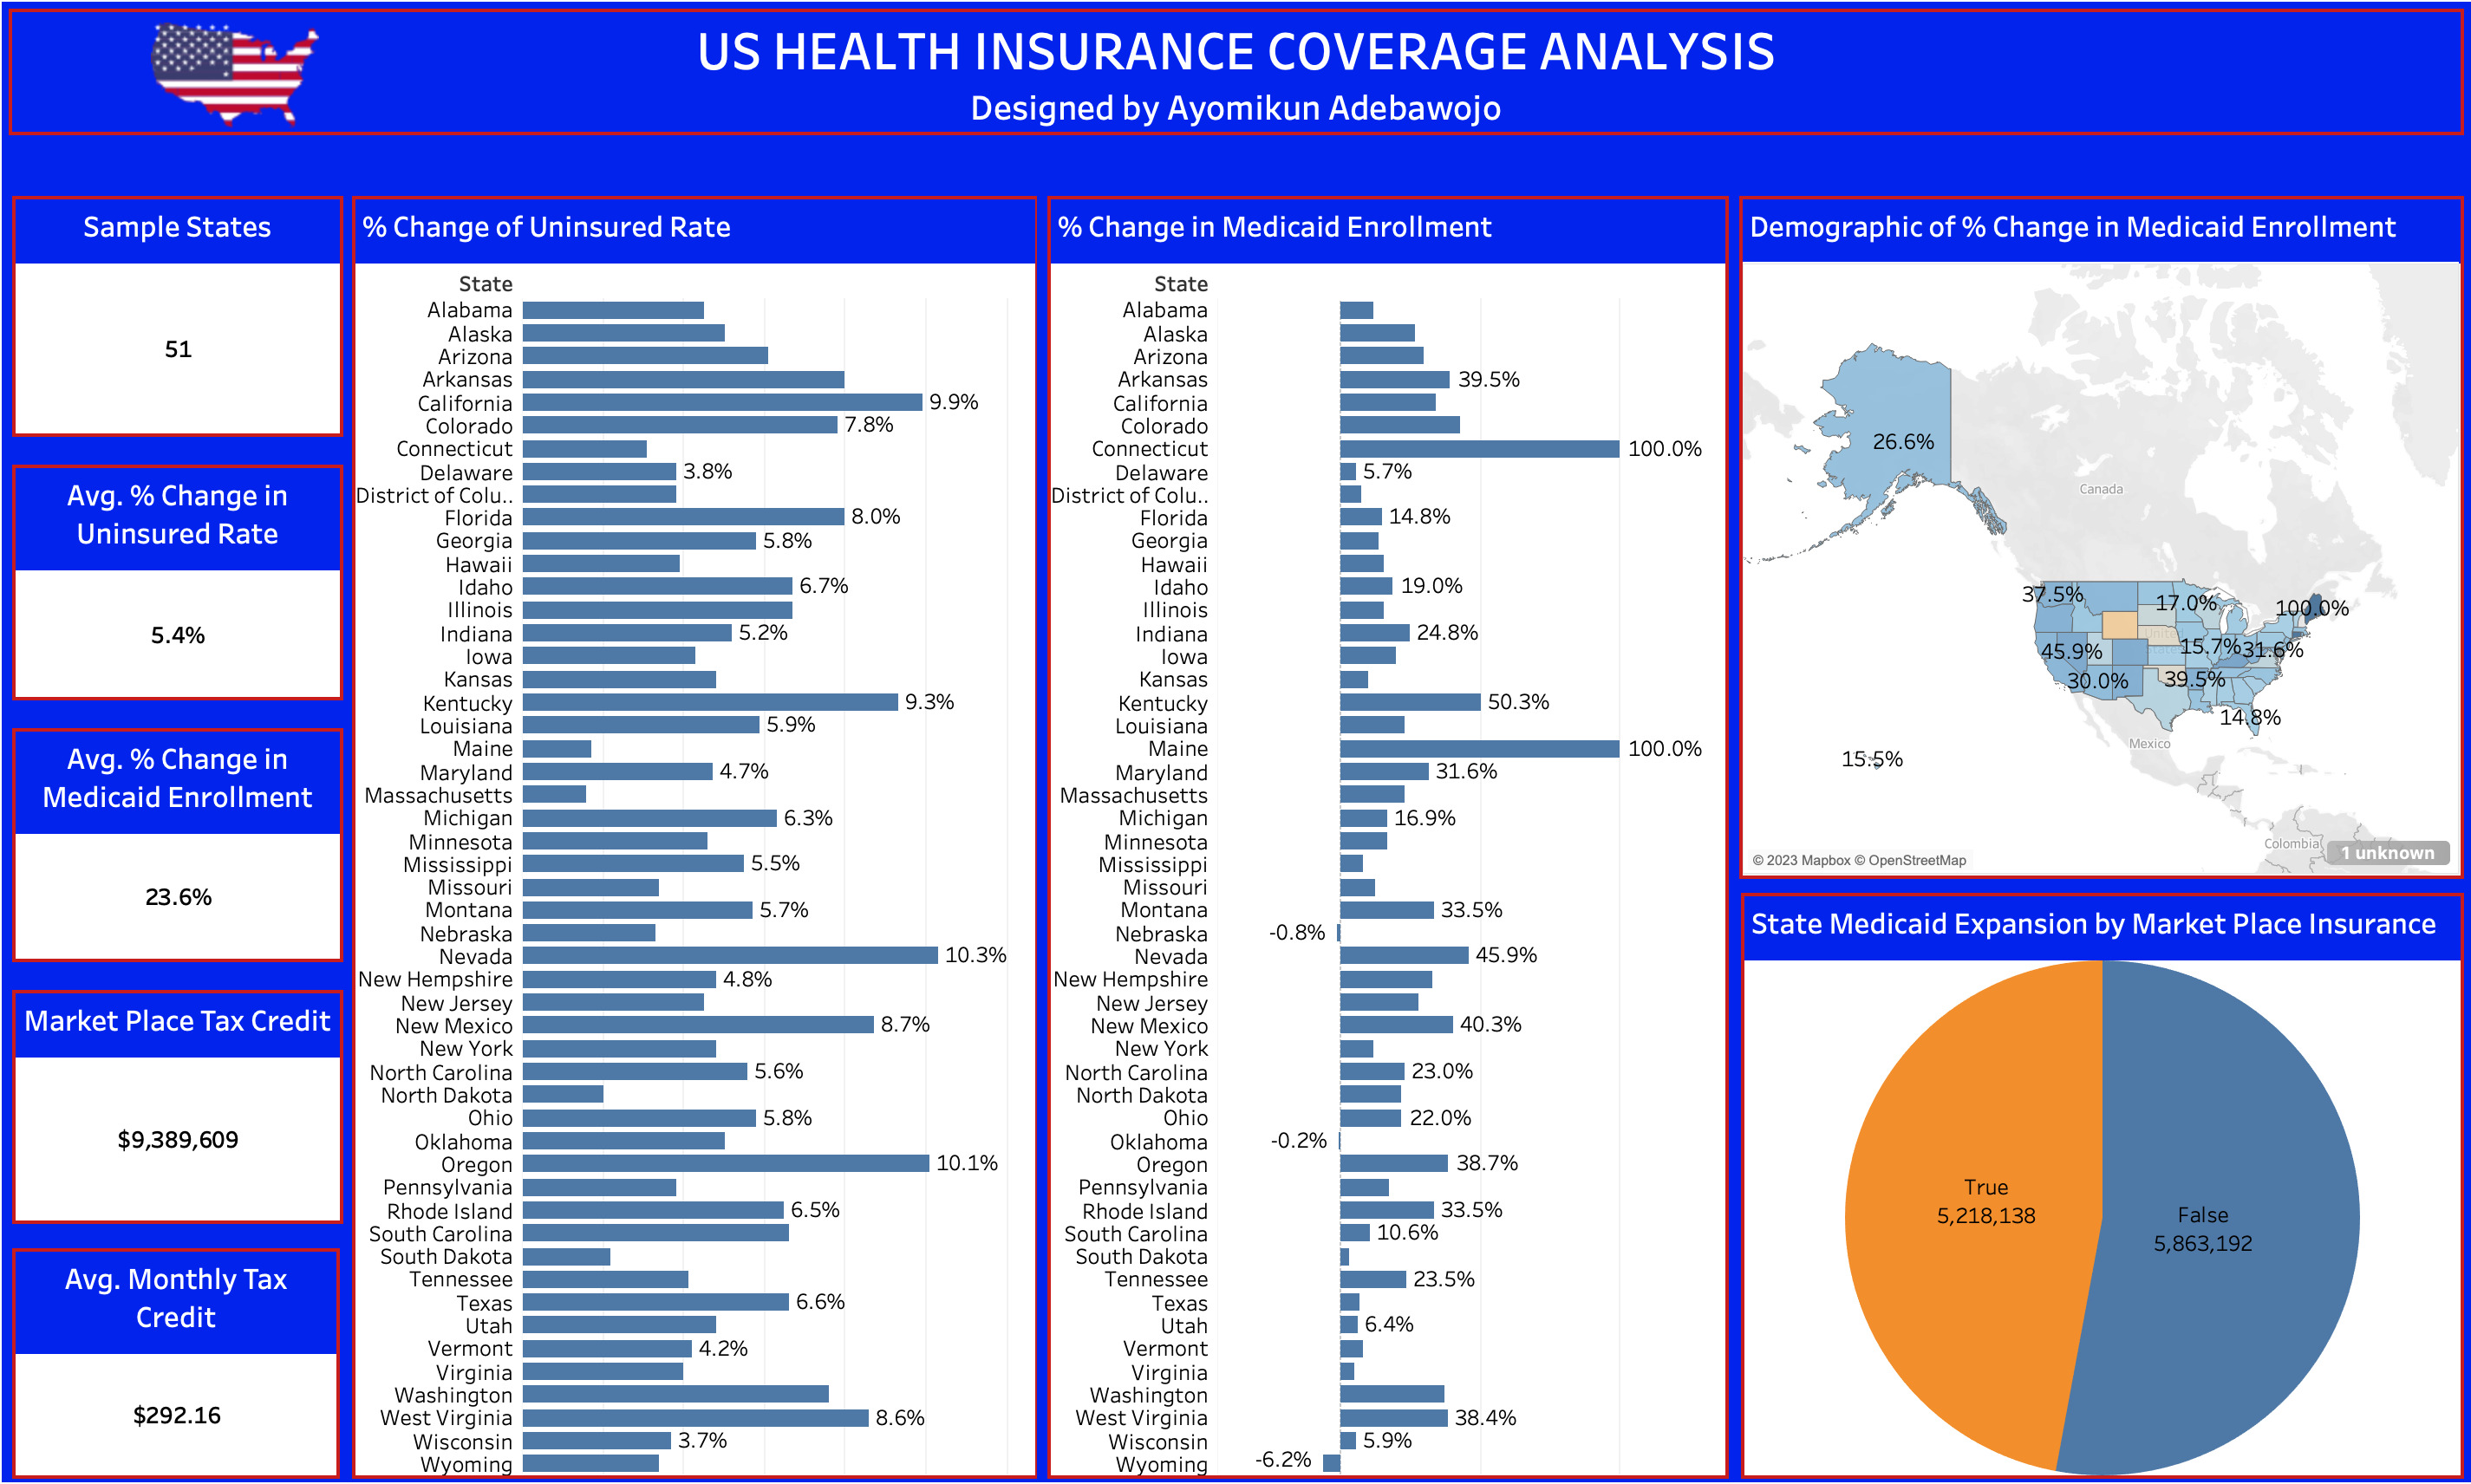
My analysis of the Affordable Care Act (ACA) using Tableau examines changes in health insurance coverage across 51 U.S. states, revealing a 5.4% decrease in the uninsured rate and a 23.6% increase in Medicaid enrollment, with average monthly tax credits of $292. Notably, Nevada experienced a 10.3% rise in uninsured rates, while Connecticut and Maine saw a remarkable 100% increase in Medicaid enrollment, highlighting varied state responses.
To improve healthcare outcomes, I recommend targeted outreach in states with rising uninsured rates and strategies to promote Medicaid awareness in regions with low enrollment. Additionally, educational initiatives should clarify the implications of Medicaid expansion, and policymakers should leverage state-level data to address regional challenges effectively.
W.H.O COVID-19 Analysis
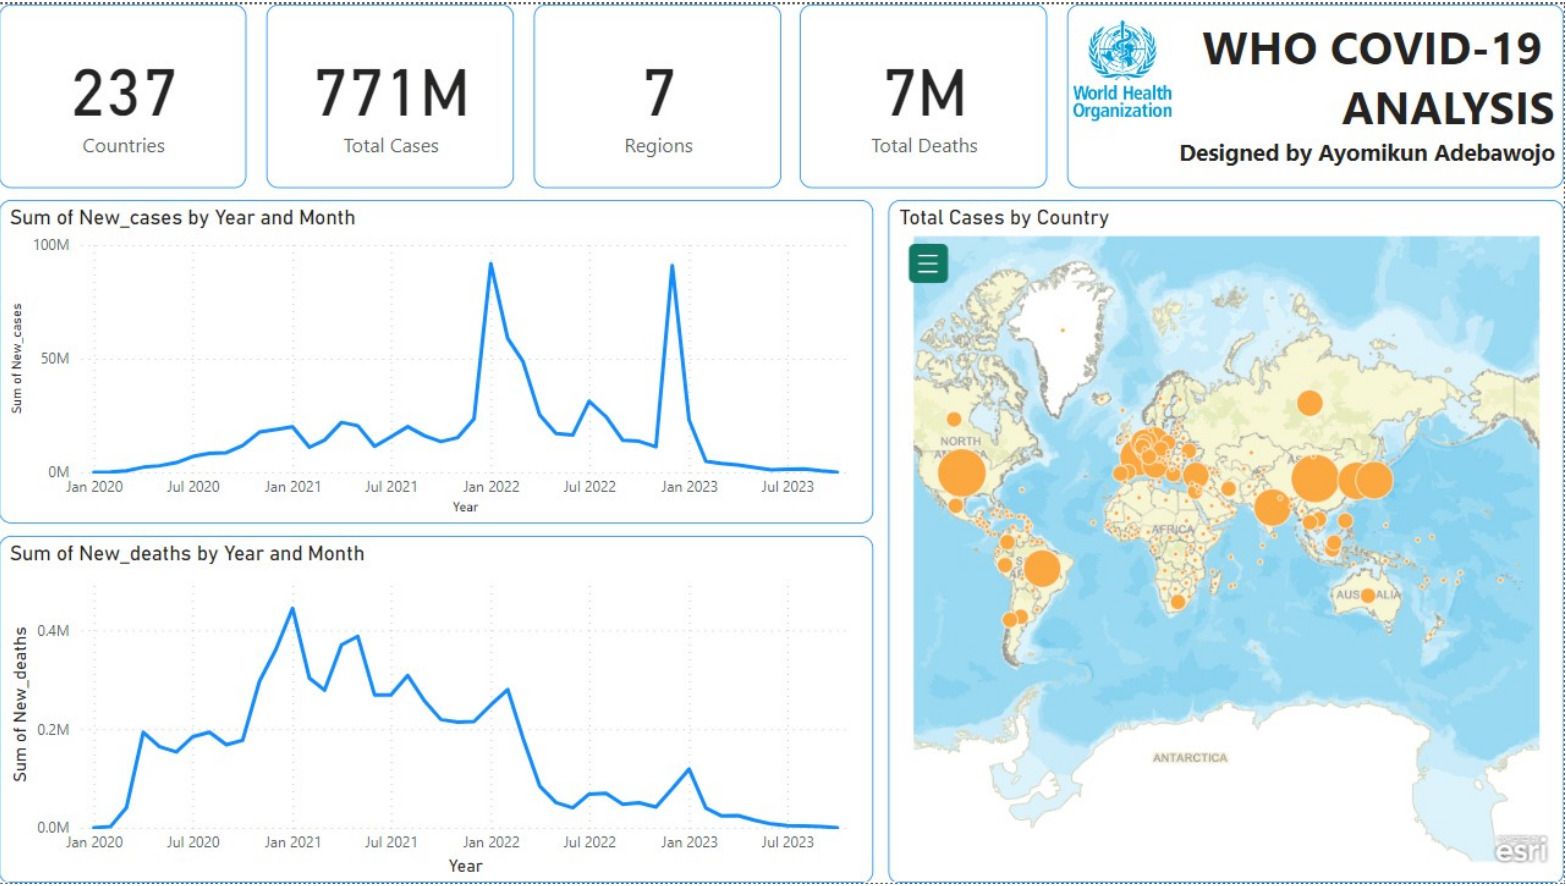
My analysis of COVID-19 data from January 2020 to October 2023 highlights a 444.17% increase in new cases, with a notable decline of 98.61% since March 2023. The EURO region accounted for 35.84% of new cases, revealing significant regional disparities, while a positive correlation between new cases and new deaths was particularly evident in the United States.
To strengthen our global response, I recommend focusing on widespread vaccination campaigns, enhancing healthcare infrastructure, and utilising data-driven decision-making in public health strategies. Additionally, promoting international collaboration in research and resource sharing will be crucial for managing ongoing pandemic challenges and preparing for future health crises.
Unraveling the Cholera Outbreak of 1853 (Stockholm Cholera)
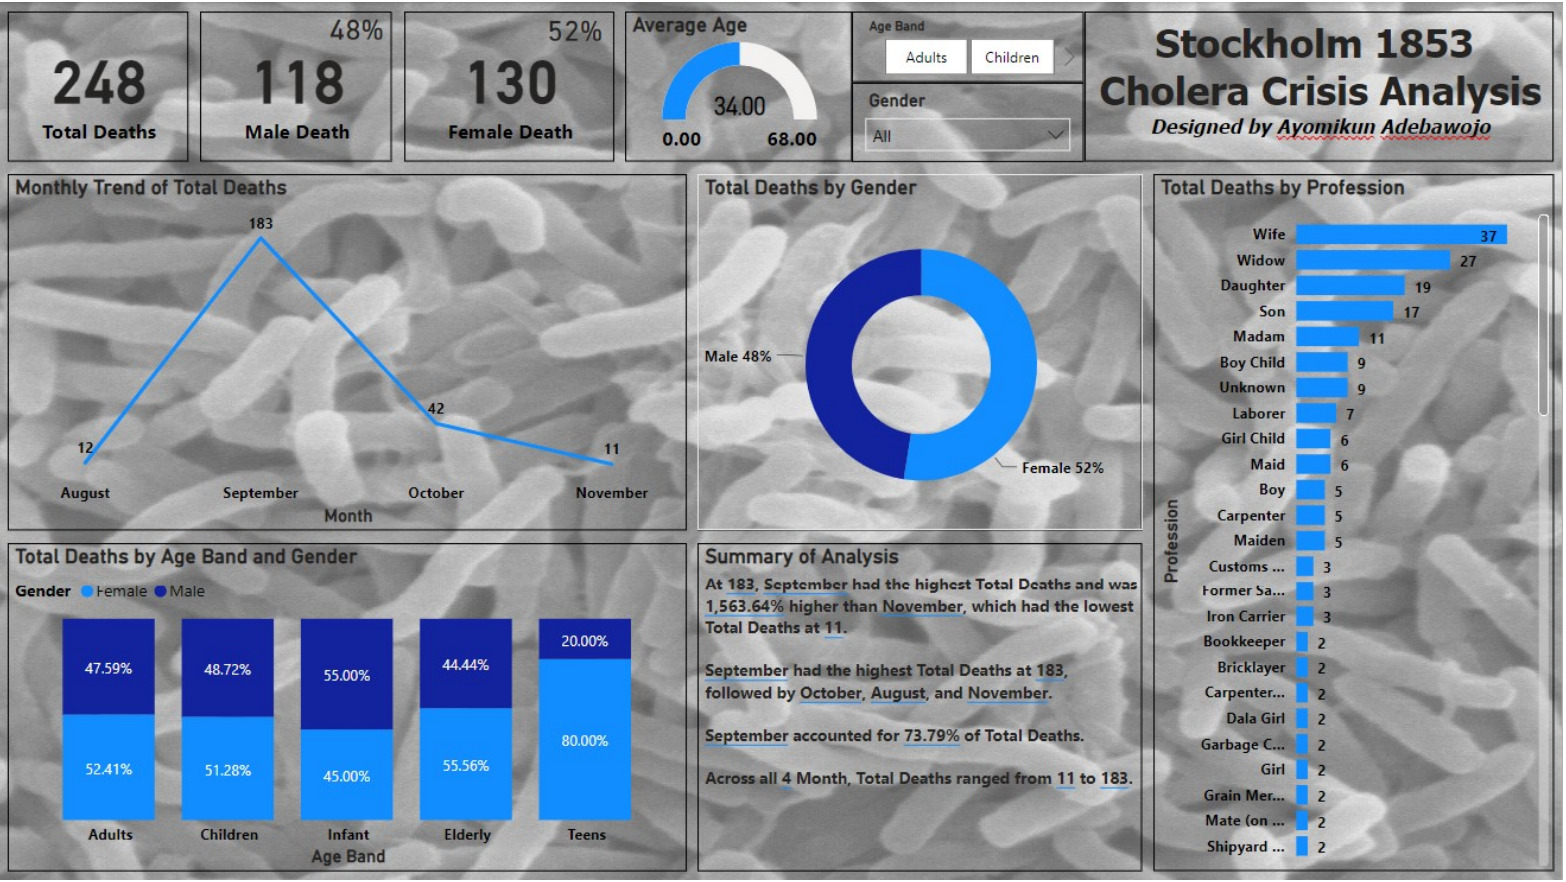
My analysis of the cholera outbreak in Stockholm in August 1853 revealed the severe impact of the epidemic, which resulted in about 3% of the population succumbing to the disease within weeks. Utilising historical data from church records and PowerBI, I found that September was the peak month for deaths, accounting for 73.79% of fatalities, particularly affecting areas like St. Catherine Parish.
The study also highlighted gender disparities, with more female deaths (130) compared to males (118), especially among wives, widows, and daughters. This research underscores the significant challenges faced in 19th-century urban environments with inadequate sanitation and emphasises the importance of data in understanding past pandemics to inform future public health measures.
Unlocking the Depths: Analysing a Century of Shark Attacks
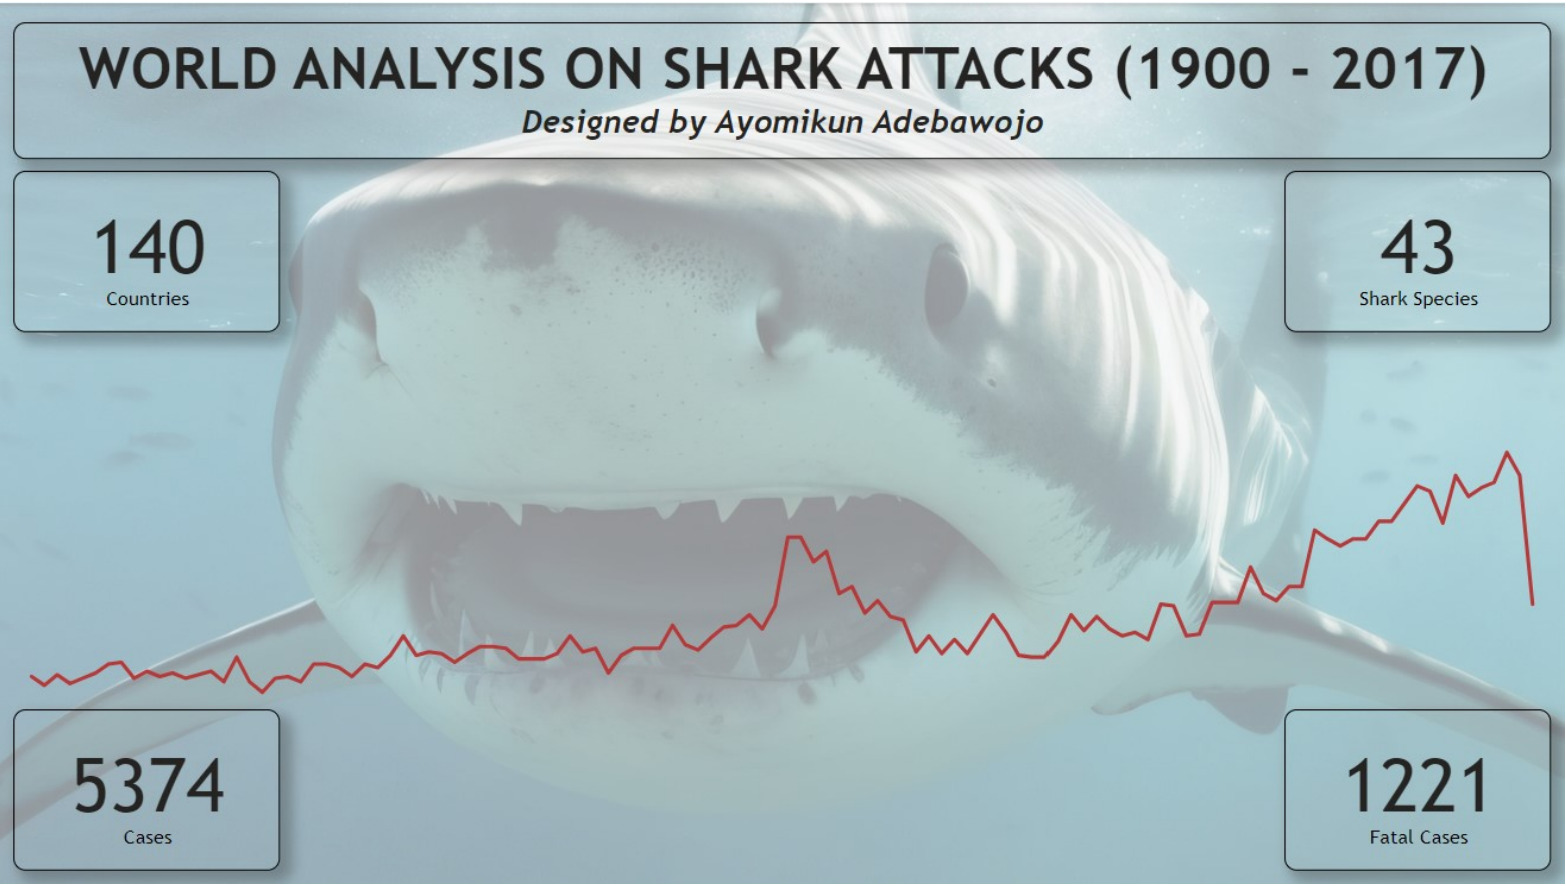
My analysis of shark attacks over the past century reveals a significant 292.86% increase in incidents and a 20% rise in fatalities from 1900 to 2017, particularly steep after 1996. The USA is the leading location for shark attacks, with a staggering 3,449.12% more than Réunion. The demographic insights show that adults face the highest risk, experiencing 8,473.17% more attacks than the elderly, with afternoons identified as the peak time for incidents.
To improve safety, I recommend advanced monitoring systems in high-risk areas and targeted education programs for at-risk demographics. Conducting regional risk assessments will help pinpoint specific threats, while implementing time-specific safety measures during peak hours can further protect beachgoers and water enthusiasts. This analysis highlights the value of data-driven strategies in enhancing public safety and understanding shark attack trends.
Analysis of Nigeria's COVID-19 Cases
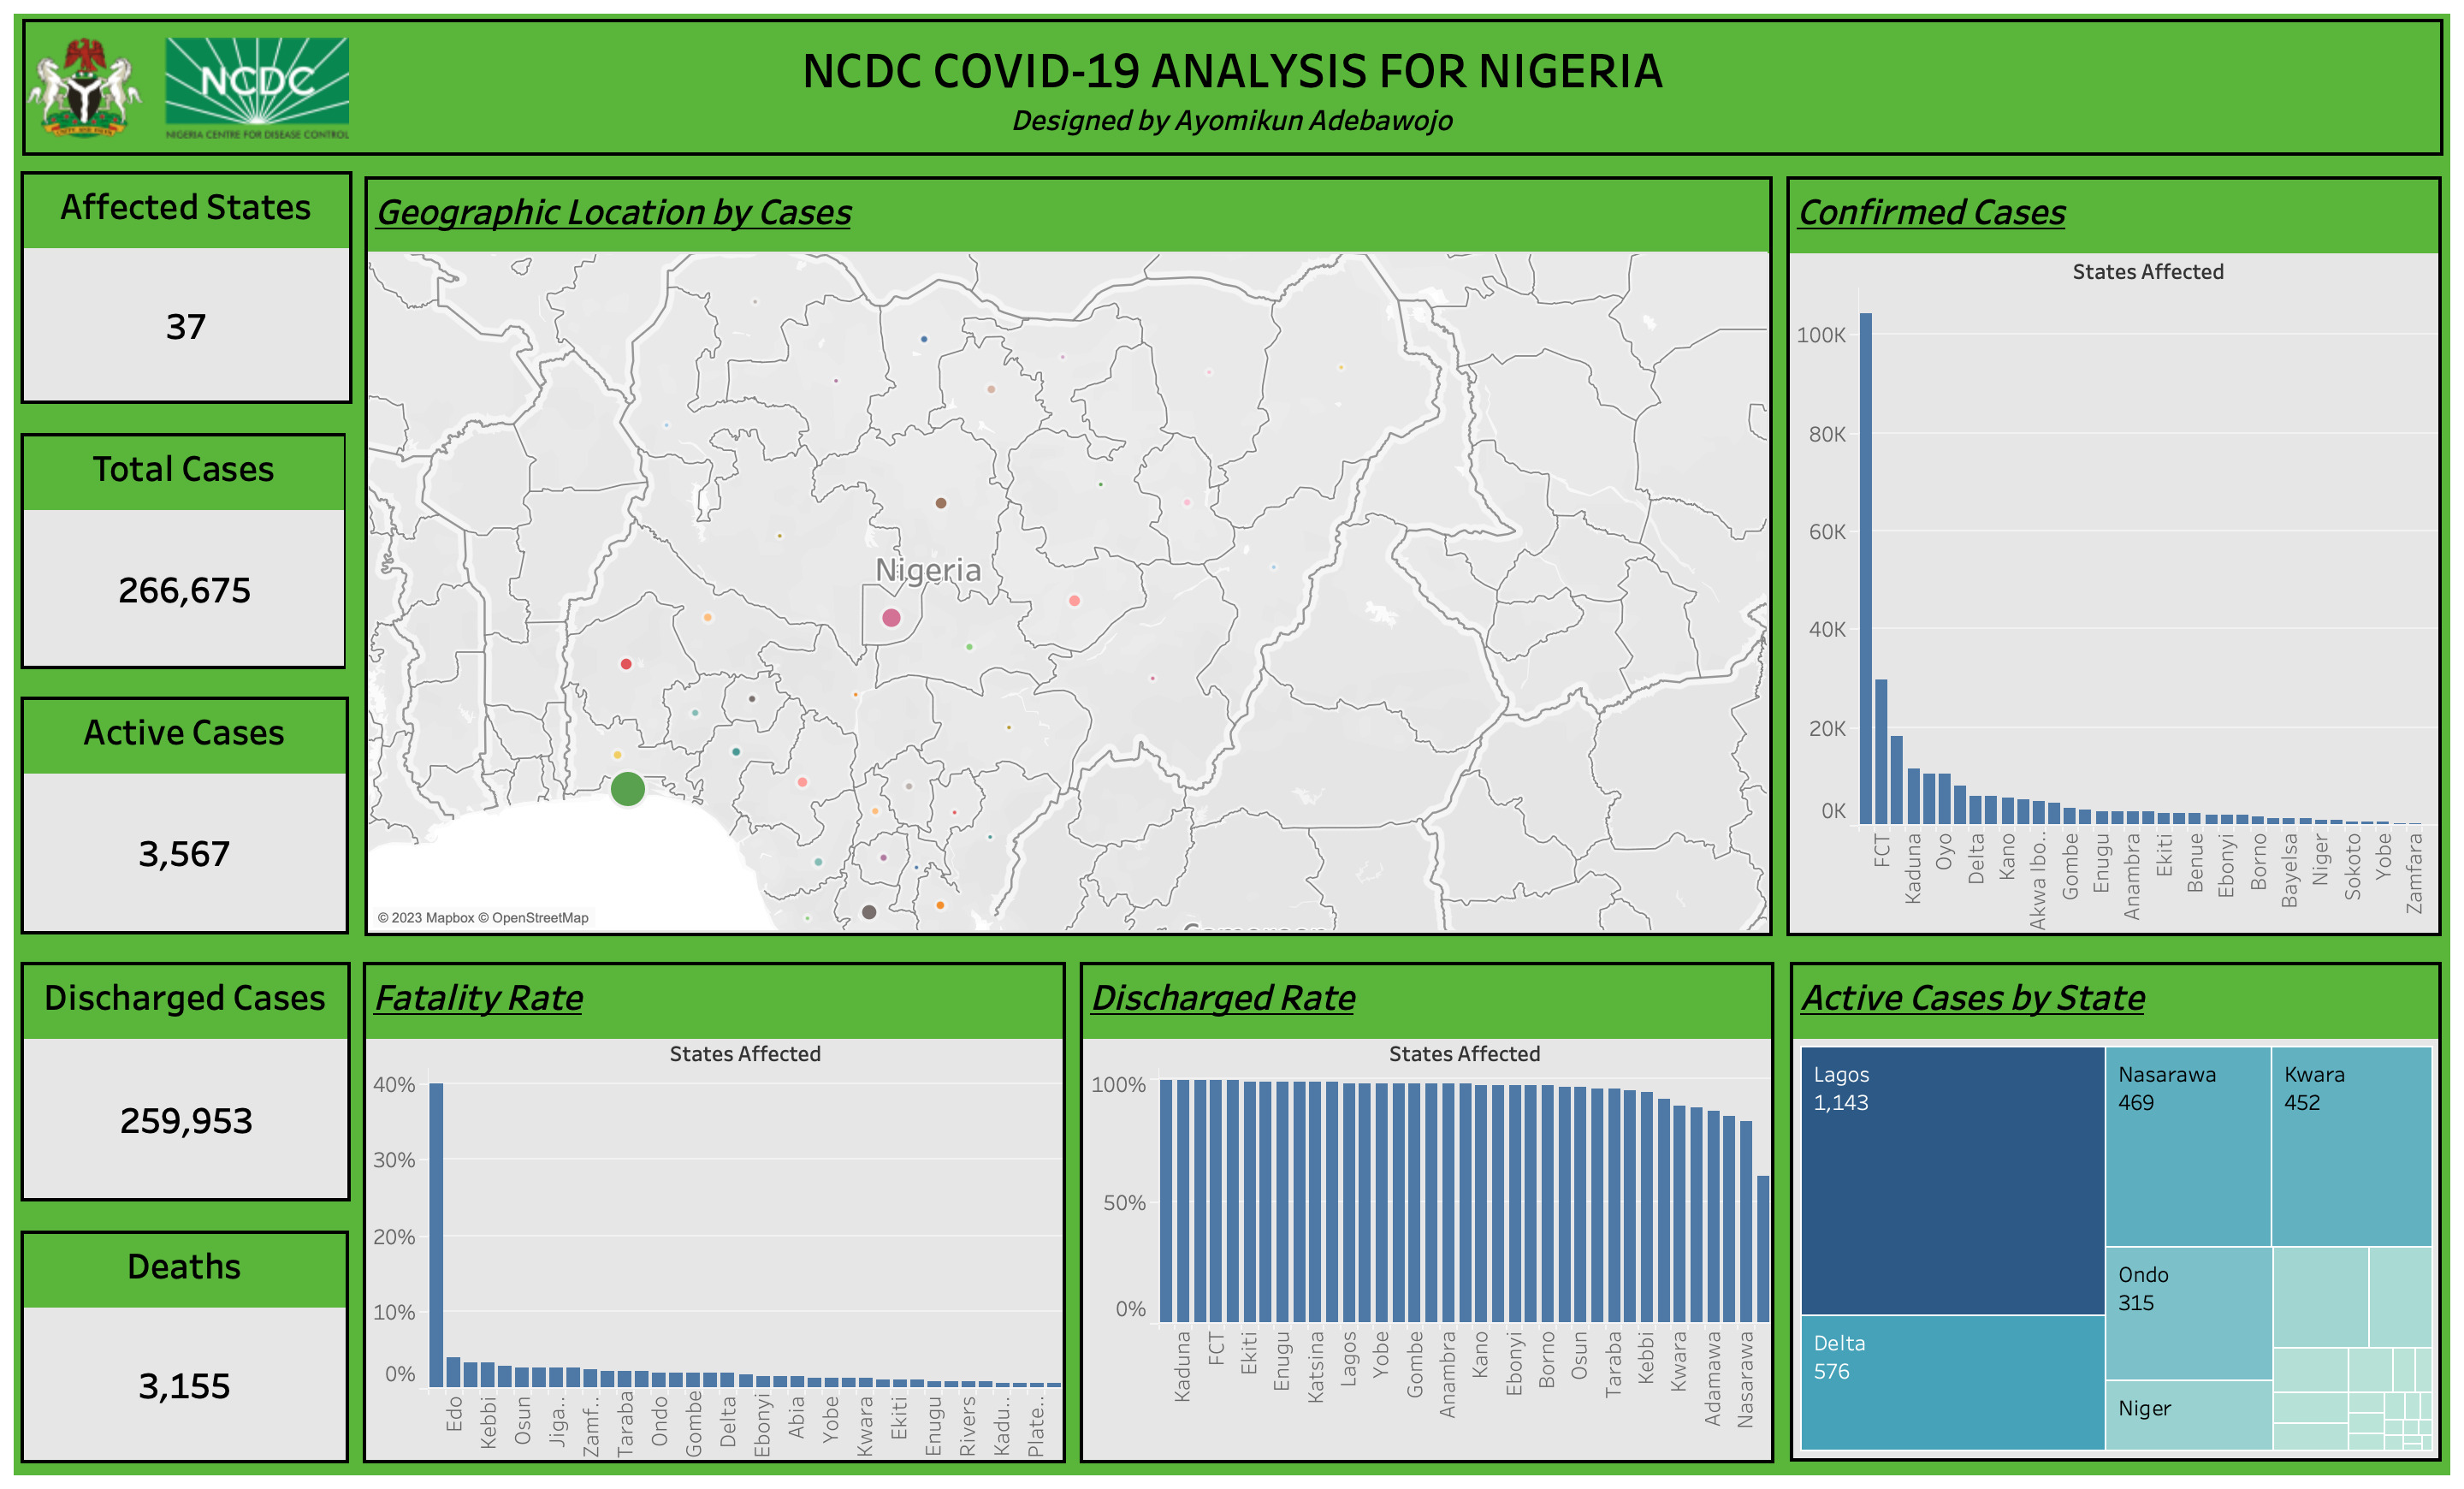
I analysed Nigeria's COVID-19 data using Tableau, providing a comprehensive view of the pandemic's impact across the country. The dataset from the Nigeria Centre for Disease Control (NCDC) covers confirmed cases, active cases, discharges, deaths, and the geographical distribution of all 36 states and the Federal Capital Territory. Key findings reveal that Nigeria reported 266,675 confirmed cases, with Lagos State accounting for 39% of the total, while Kogi State had the fewest cases.
The analysis highlighted a discharge rate of 99% in most states, although Kogi State experienced a fatality rate of 40%, contrasting with Lagos's 1%. For future pandemic preparedness, I recommend investing in healthcare infrastructure, promoting local research and development, maintaining transparent data reporting, and developing comprehensive emergency plans to ensure effective responses to health crises.
Maternal Health Risk Analysis
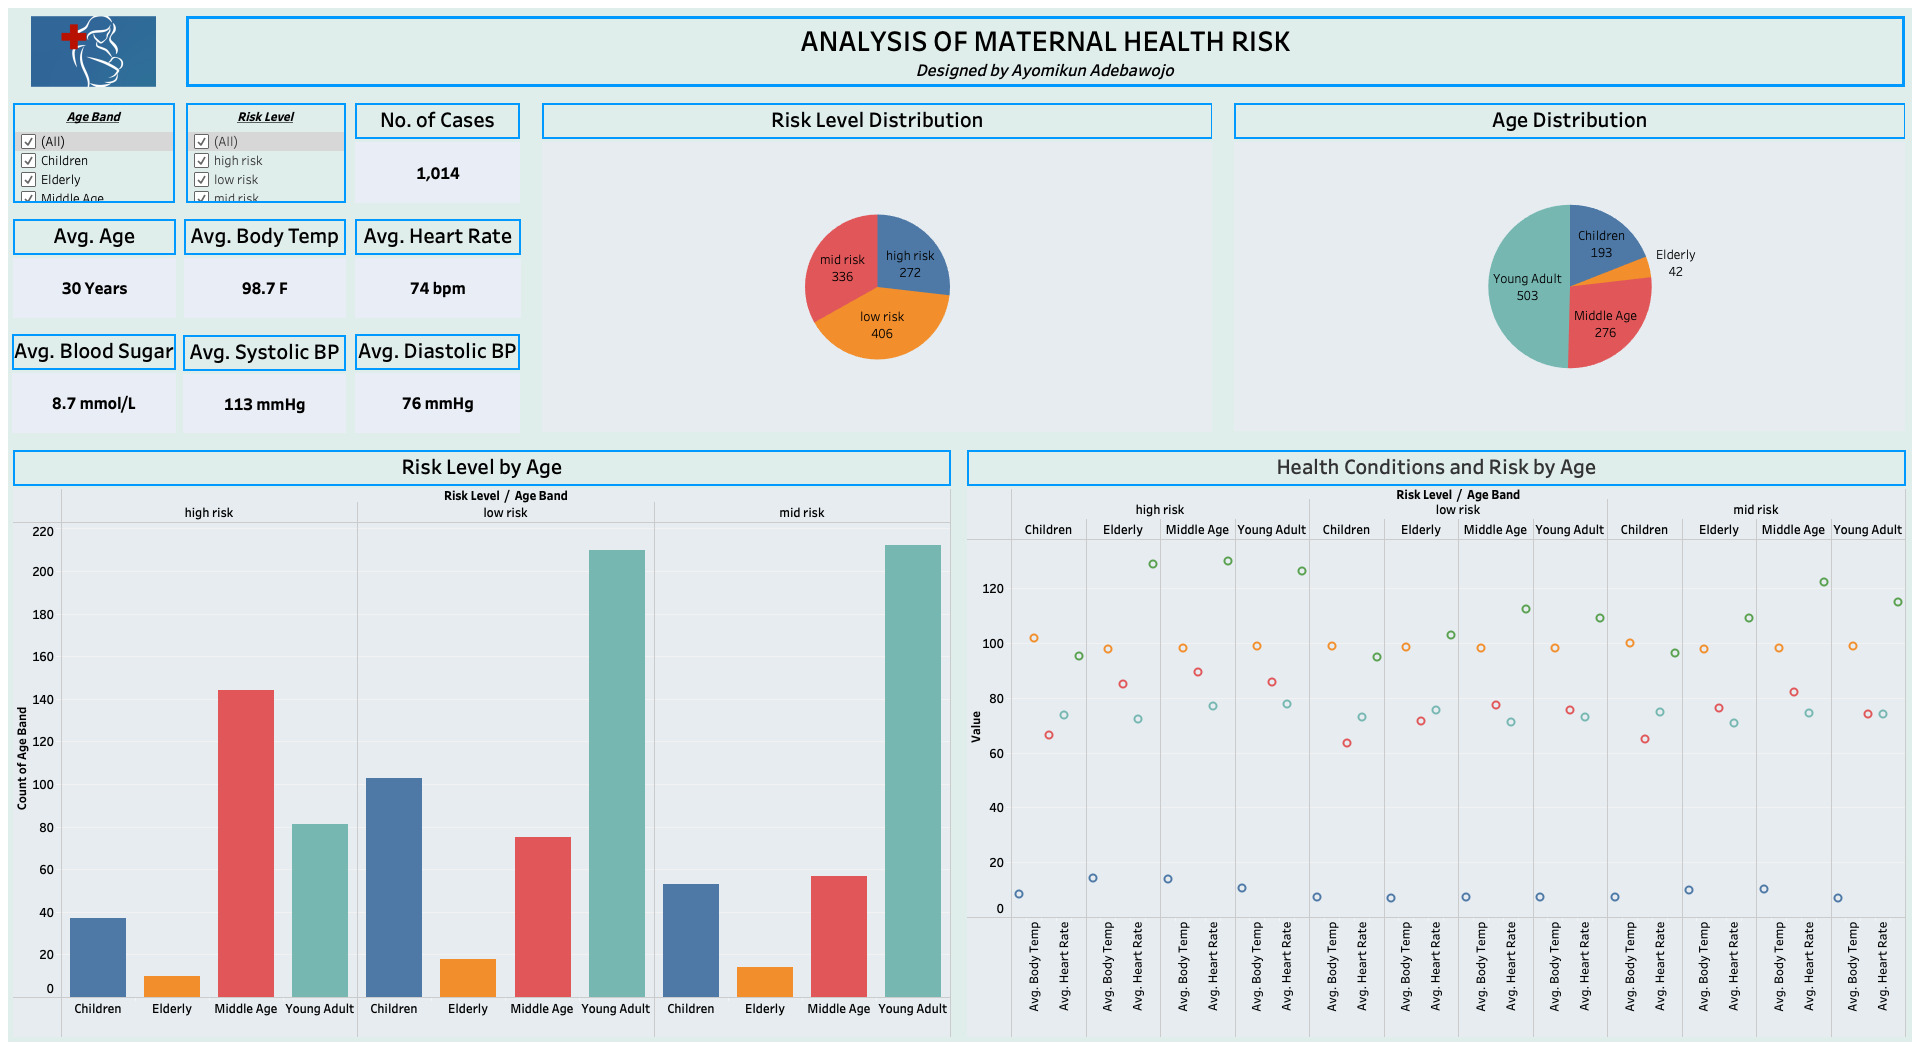
I conducted an in-depth analysis of maternal health risk factors using a dataset from Quantum Analytics NG, visualised with Tableau. This dataset, collected from healthcare facilities via an IoT-based monitoring system, examined key pregnancy indicators such as age, blood pressure, blood glucose levels, heart rate, and risk intensity across 1,014 cases. The analysis revealed critical patterns, including elevated blood sugar levels in elderly patients and higher body temperatures in mid-risk children, which indicate significant health risks during pregnancy.
Key findings highlighted that 53% of middle-aged mothers (ages 35-59) were at high risk, with elevated blood pressure also being a major concern among this group. To address these risks, I recommend targeted monitoring and intervention strategies to manage high blood sugar, temperature, blood pressure, and heart rate, especially for high-risk age groups.
US Birth Analysis (2016-2021)
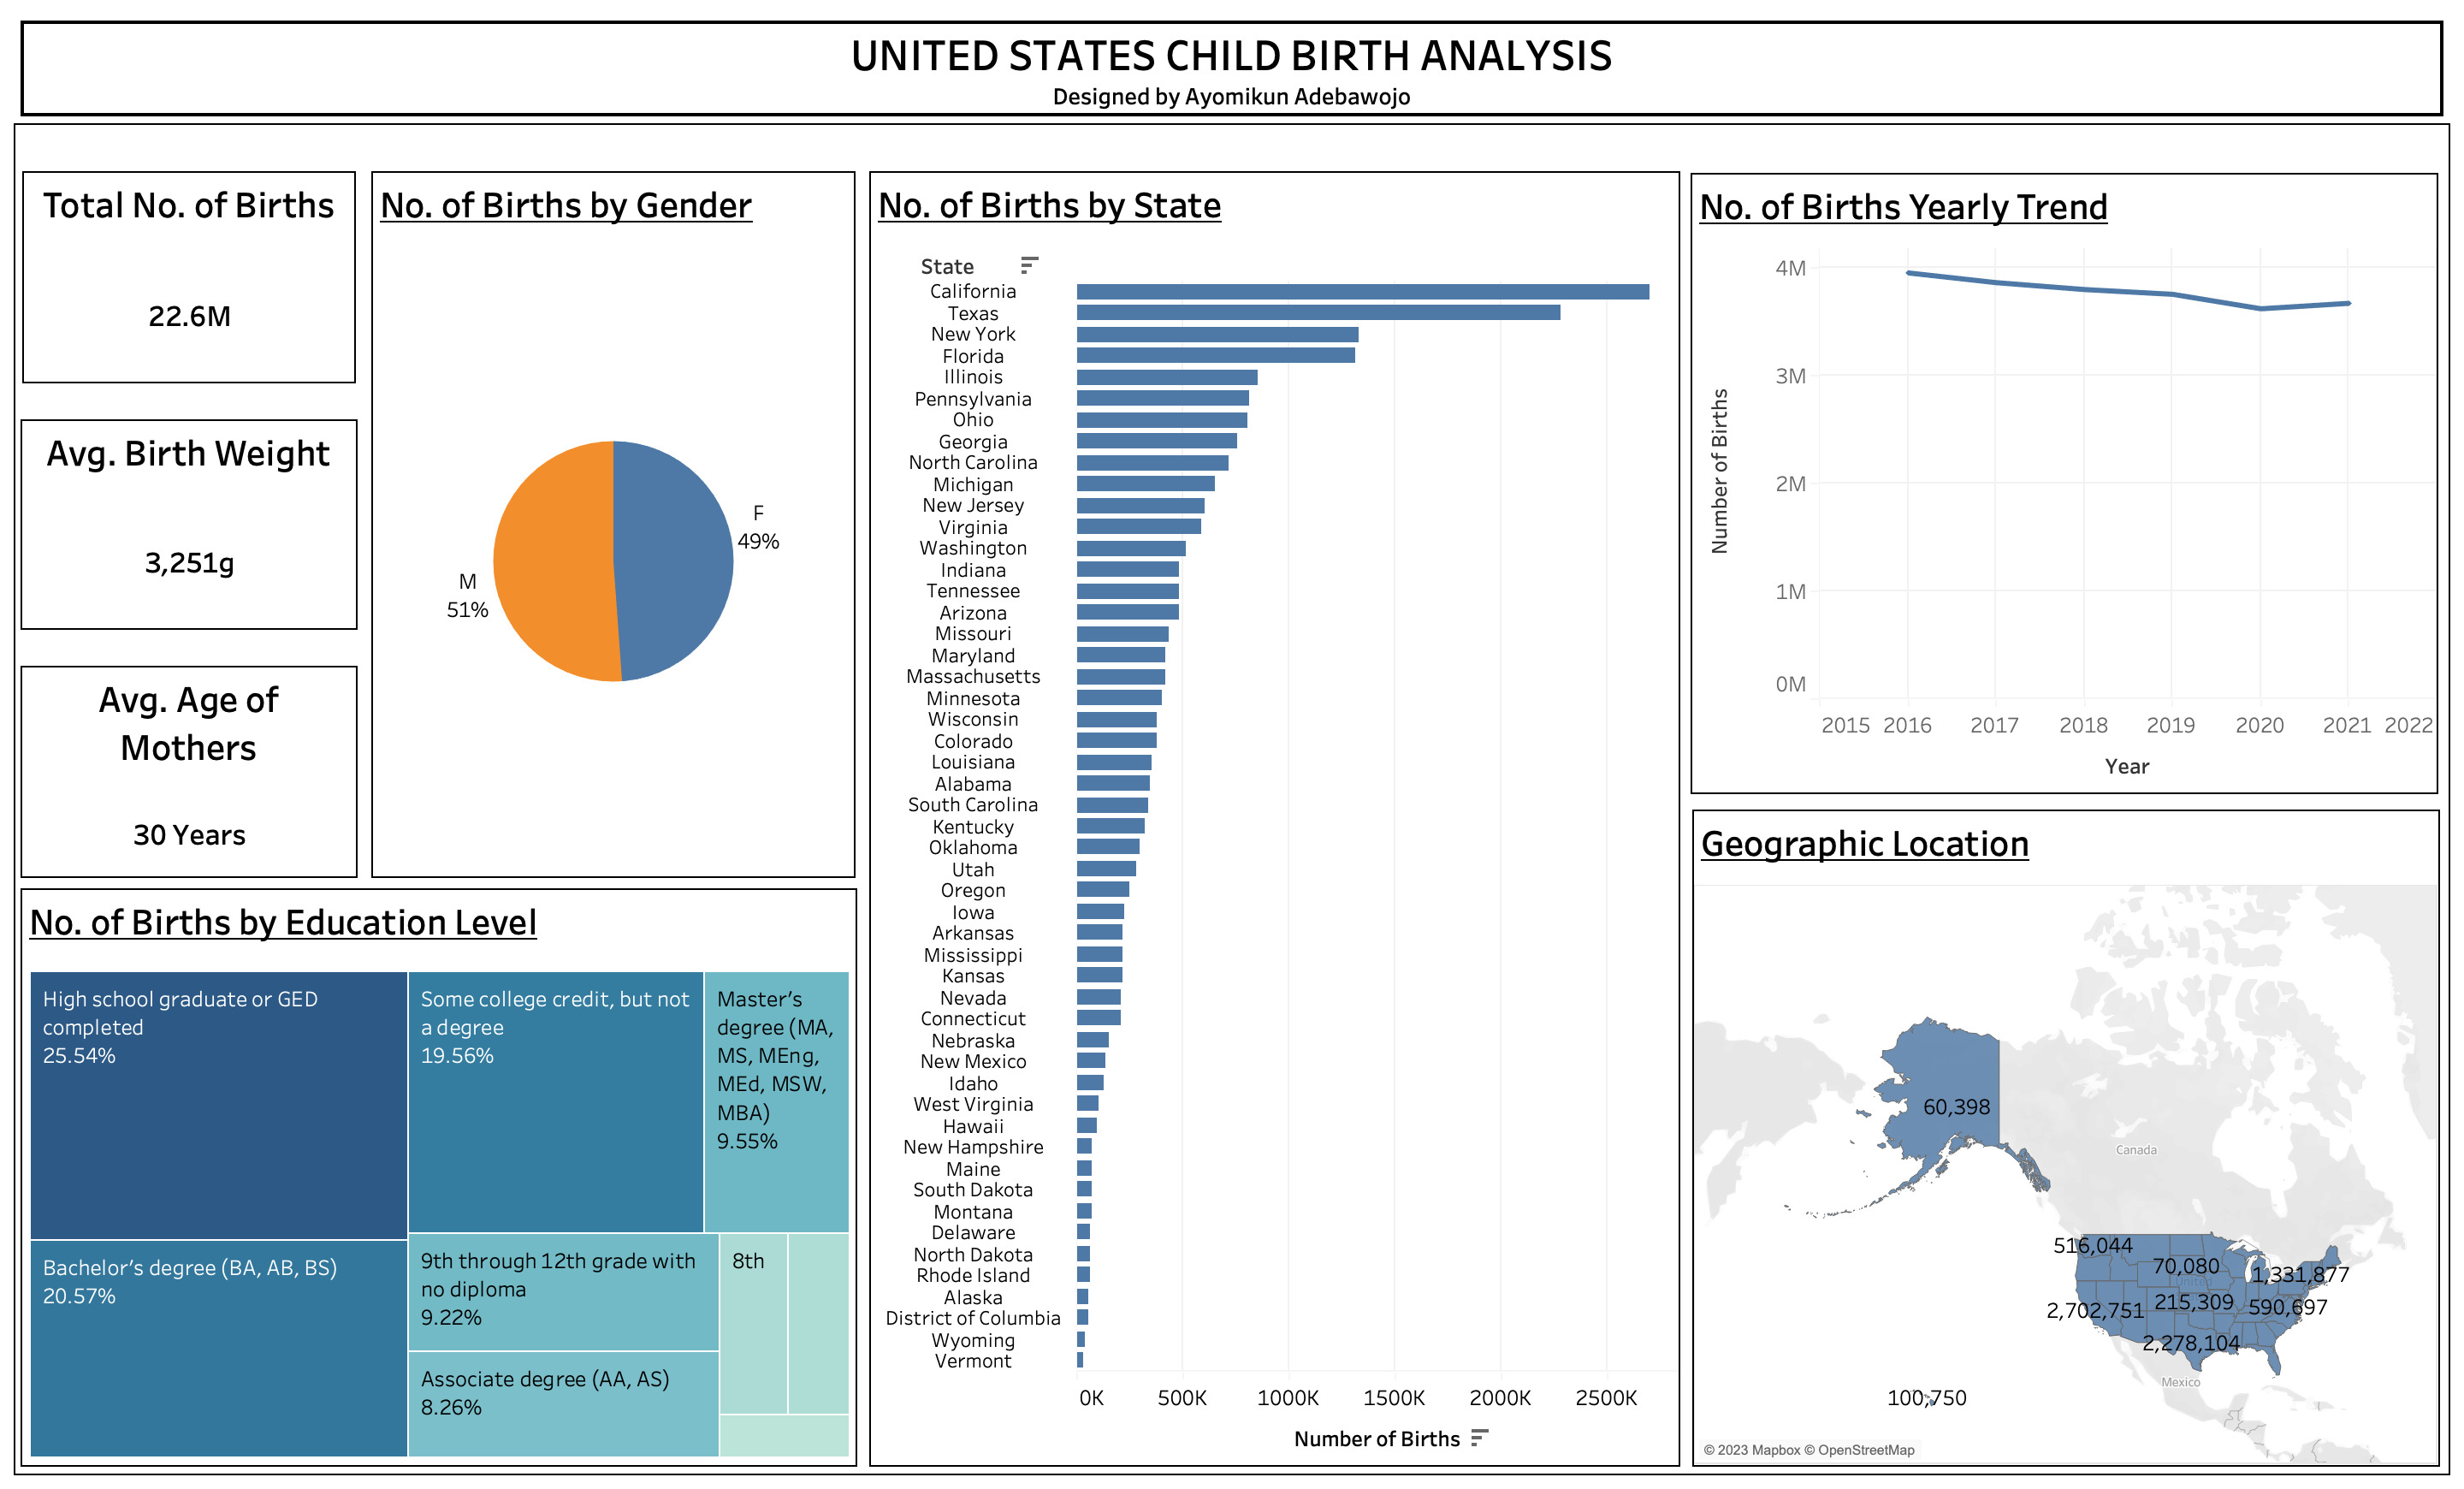
I analysed US birth rates from 2016 to 2021 using a dataset from the CDC, employing Tableau for visualisation and Microsoft Excel for data cleaning. The study revealed 22.6 million births across 51 states, with California leading at 2.7 million and Vermont at around 30,000. The analysis noted a gender split of 51% male to 49% female and a decline in overall births from 3.9 million in 2016 to 3.6 million in 2021, alongside insights into maternal education levels.
To address these findings, I recommend targeted support for the 26% of mothers with only a high school education or GED through programs focused on prenatal education and financial planning. Additionally, states with high birth rates should enhance healthcare and educational resources, while those with lower rates should implement family planning and community initiatives to promote balanced demographic growth.