Financial Industry
Introduction
My work in finance is all about using data to manage risk, follow regulations, and understand customers better. These projects help financial organisations make smart decisions and offer secure, personalised services.
Empowering Global Insights: Unraveling Trade and Finance Trends
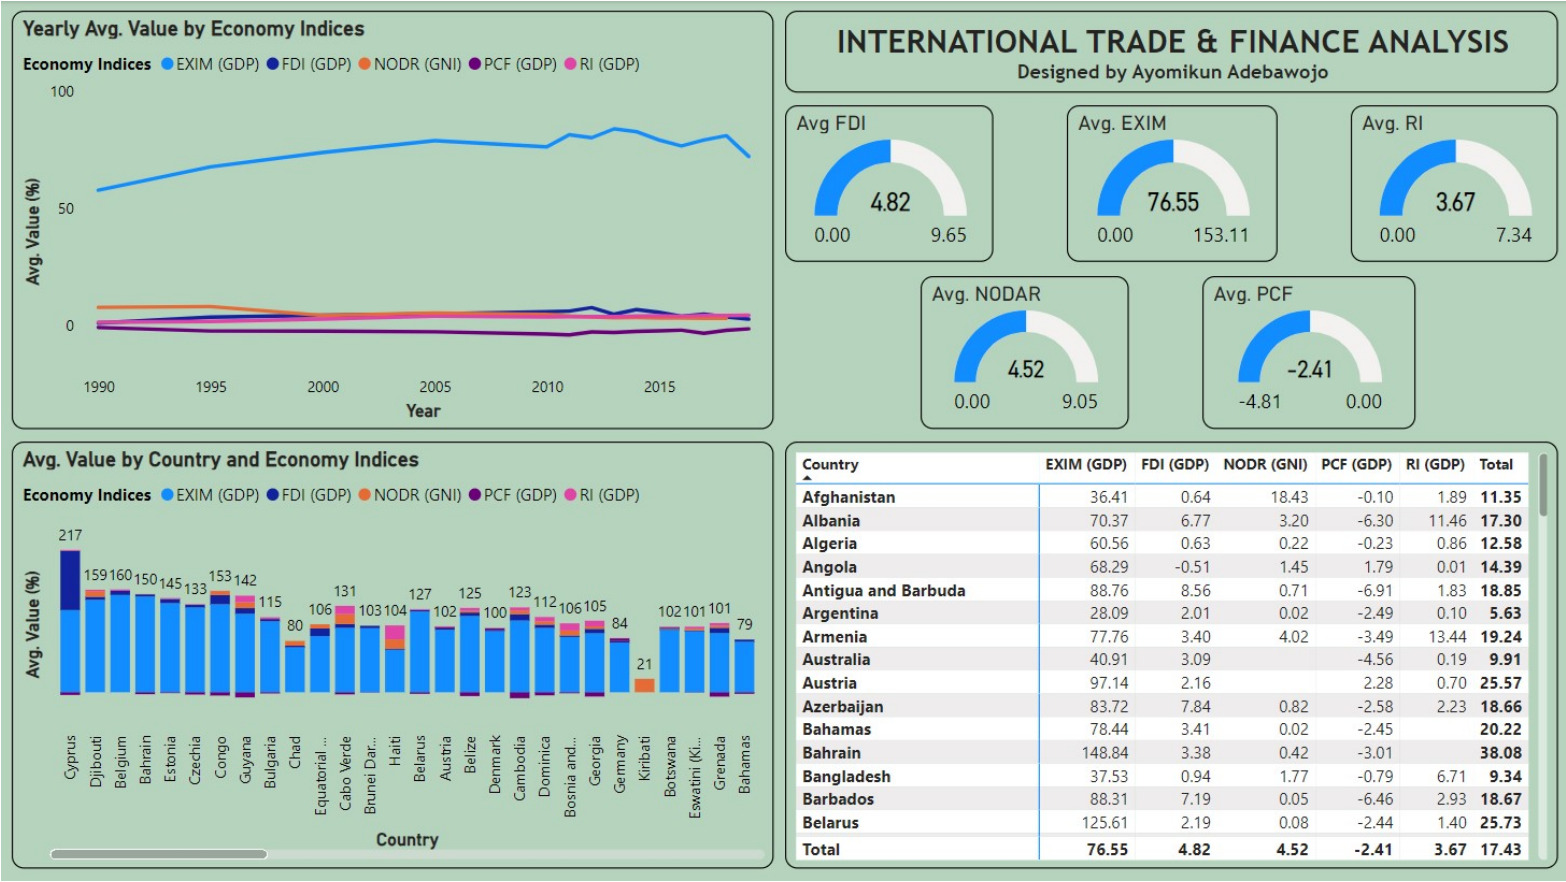
I conducted an in-depth analysis of global trade and finance trends across 190+ countries, leveraging the UN Development Program's data and PowerBI's robust analytics capabilities. The study highlighted several pivotal economic trends, including the decline in Foreign Direct Investment (FDI) since 2015, which dropped by 50.64%, underscoring challenges in attracting foreign capital. Additionally, anomalies like the private capital flow low in 2011 and Belgium's notable influence on global trade indices offer valuable markers for further exploration and targeted economic strategies.
This analysis offers strategic insights for global economies, pointing to the need for proactive investment promotion, adaptable economic policies, and international collaborations to tackle shared economic challenges. The findings emphasise the importance of data-driven decision-making, where regular, detailed analysis can help policymakers respond effectively to economic shifts, drive growth, and strengthen resilience against global market changes.
Decoding Stock Trends: A Visual Journey through the Markets
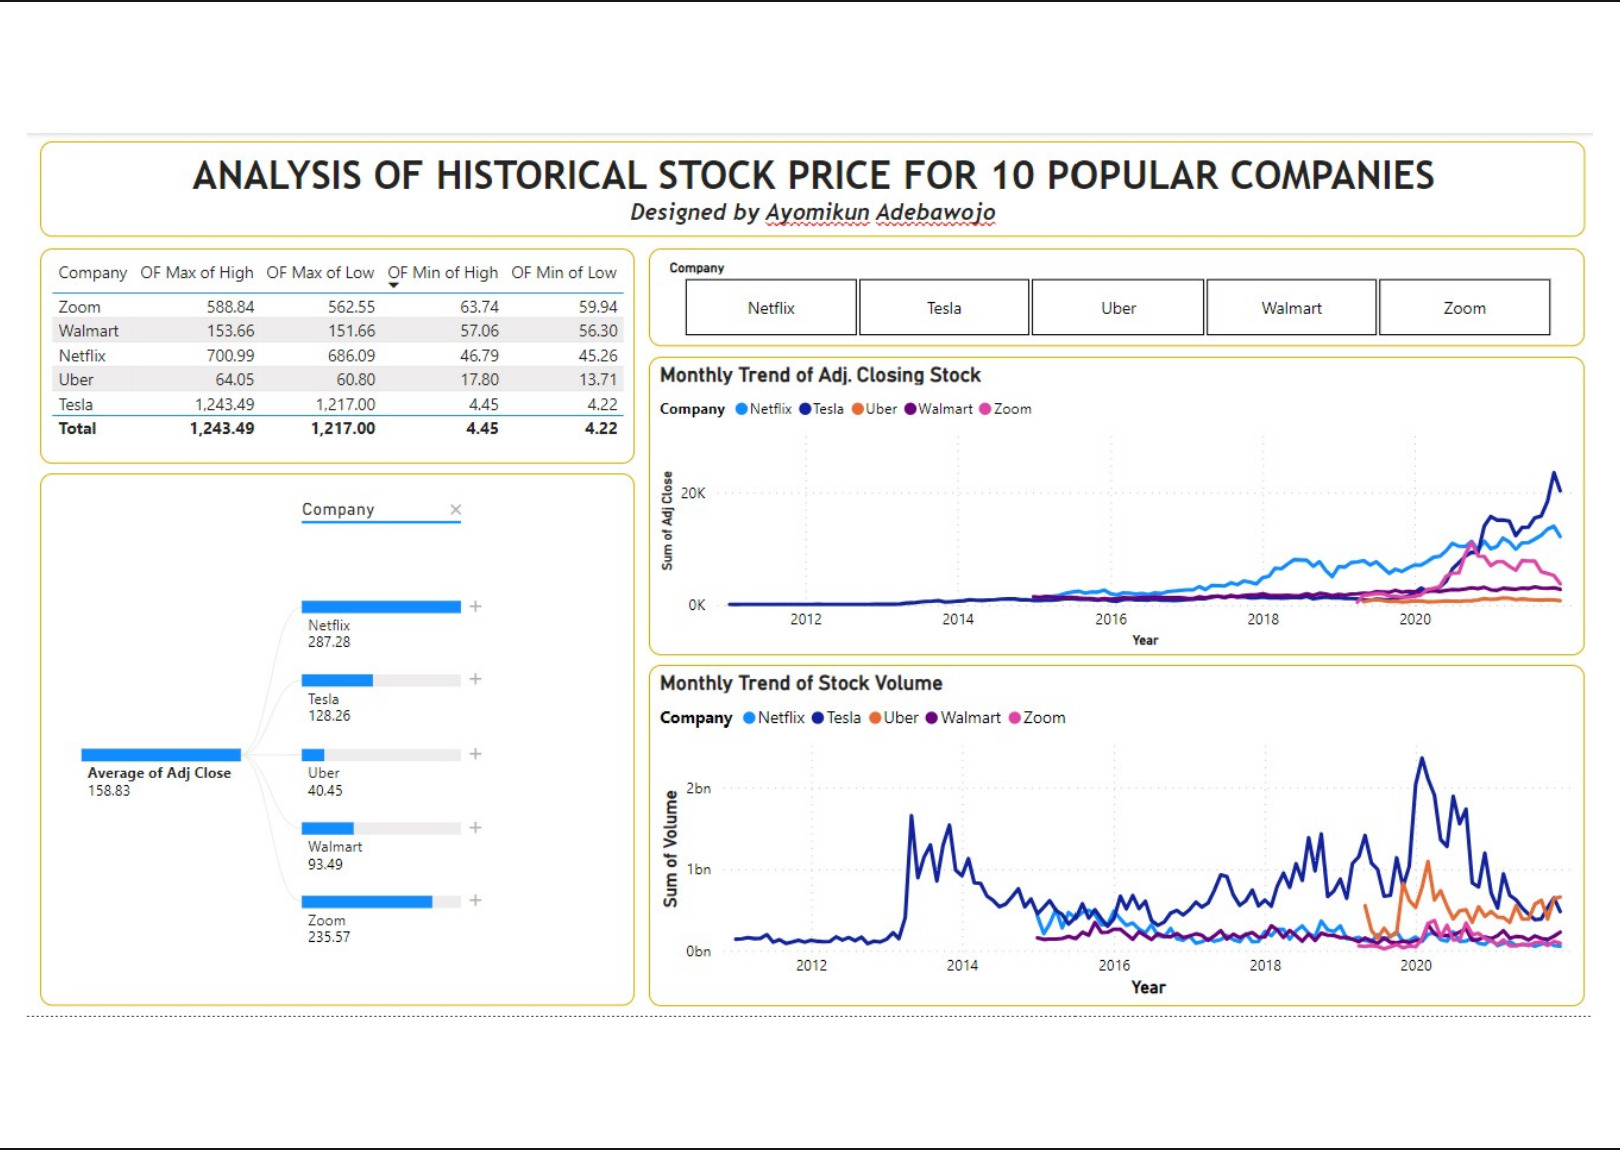
Using PowerBI to analyse historical stock data from 10 prominent companies, I revealed key trends that offer valuable insights for investors. This visual analysis highlighted Tesla's significant rise in adjusted closing prices in late 2021, Walmart's substantial volume increase during 2019–2020, and Apple's consistent upward trend beginning in September 2020. Volume anomalies across companies like Tesla and Microsoft also underscored periods of intense market activity, while Netflix showed a prolonged decline in volume, indicating shifting investor interest.
These insights provide strategic takeaways for investors. Notably, monitoring volume spikes can help identify shifts in investor sentiment, while the stability of tech giants like Apple highlights their potential as resilient investments even in volatile markets. By analysing anomalies in stock prices and volumes, investors can gain a deeper understanding of market dynamics and make more informed decisions, capitalising on key trends that could shape future market performance.
Microsoft Stock Market Analysis
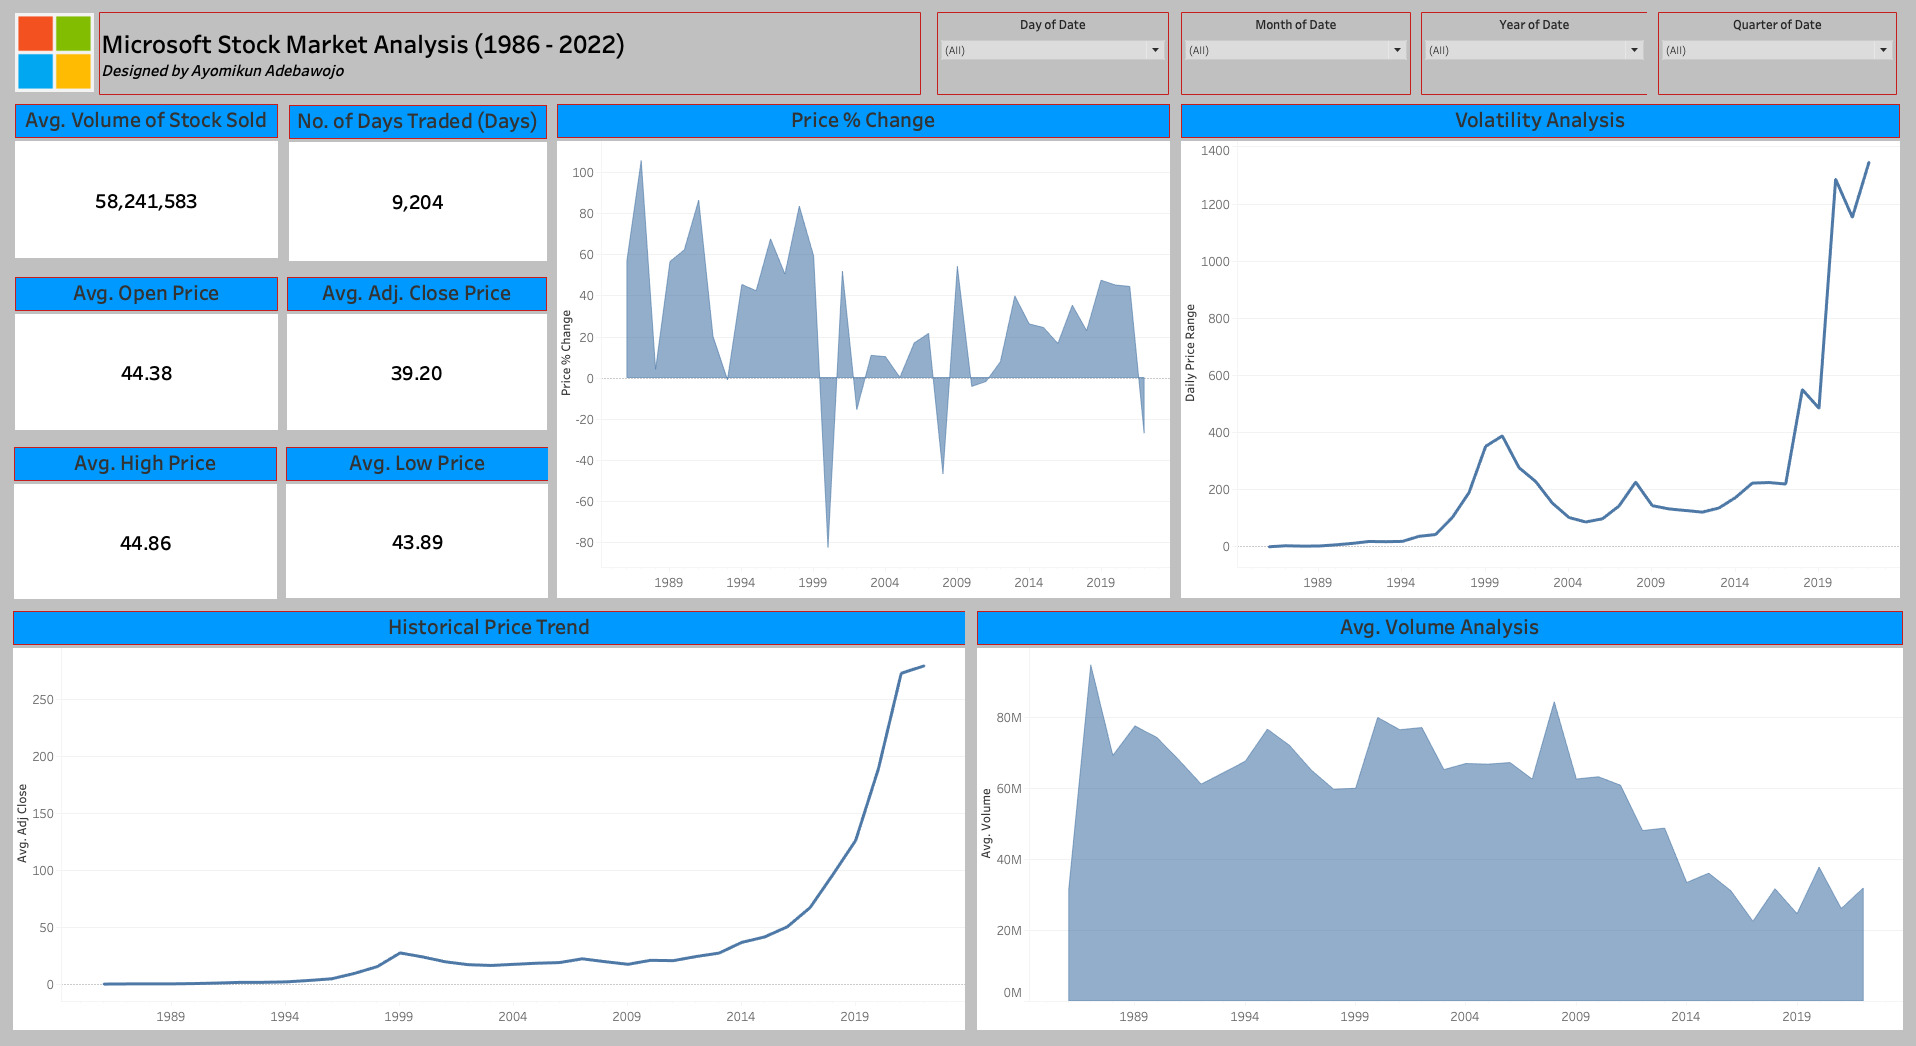
In this project, I analysed Microsoft's stock performance from 1986 to 2022, identifying key trends and patterns using a dataset of over 9,200 trading days. The analysis revealed Microsoft's steady price growth from $0.1 to $273 per share, along with a notable decrease in volatility since its peak in 1999, suggesting increased stability. Additionally, trading volume has shown a declining trend, an important factor for assessing liquidity.
Key takeaways for investors include Microsoft's strong long-term growth potential, stable investment profile, and the importance of tracking historical volatility and volume trends. Comparative analysis with other tech leaders, along with data-backed tools like Tableau, can support informed decision-making and portfolio diversification.
Exploring Bitcoin Historical Data Analysis (2011 - 2022)
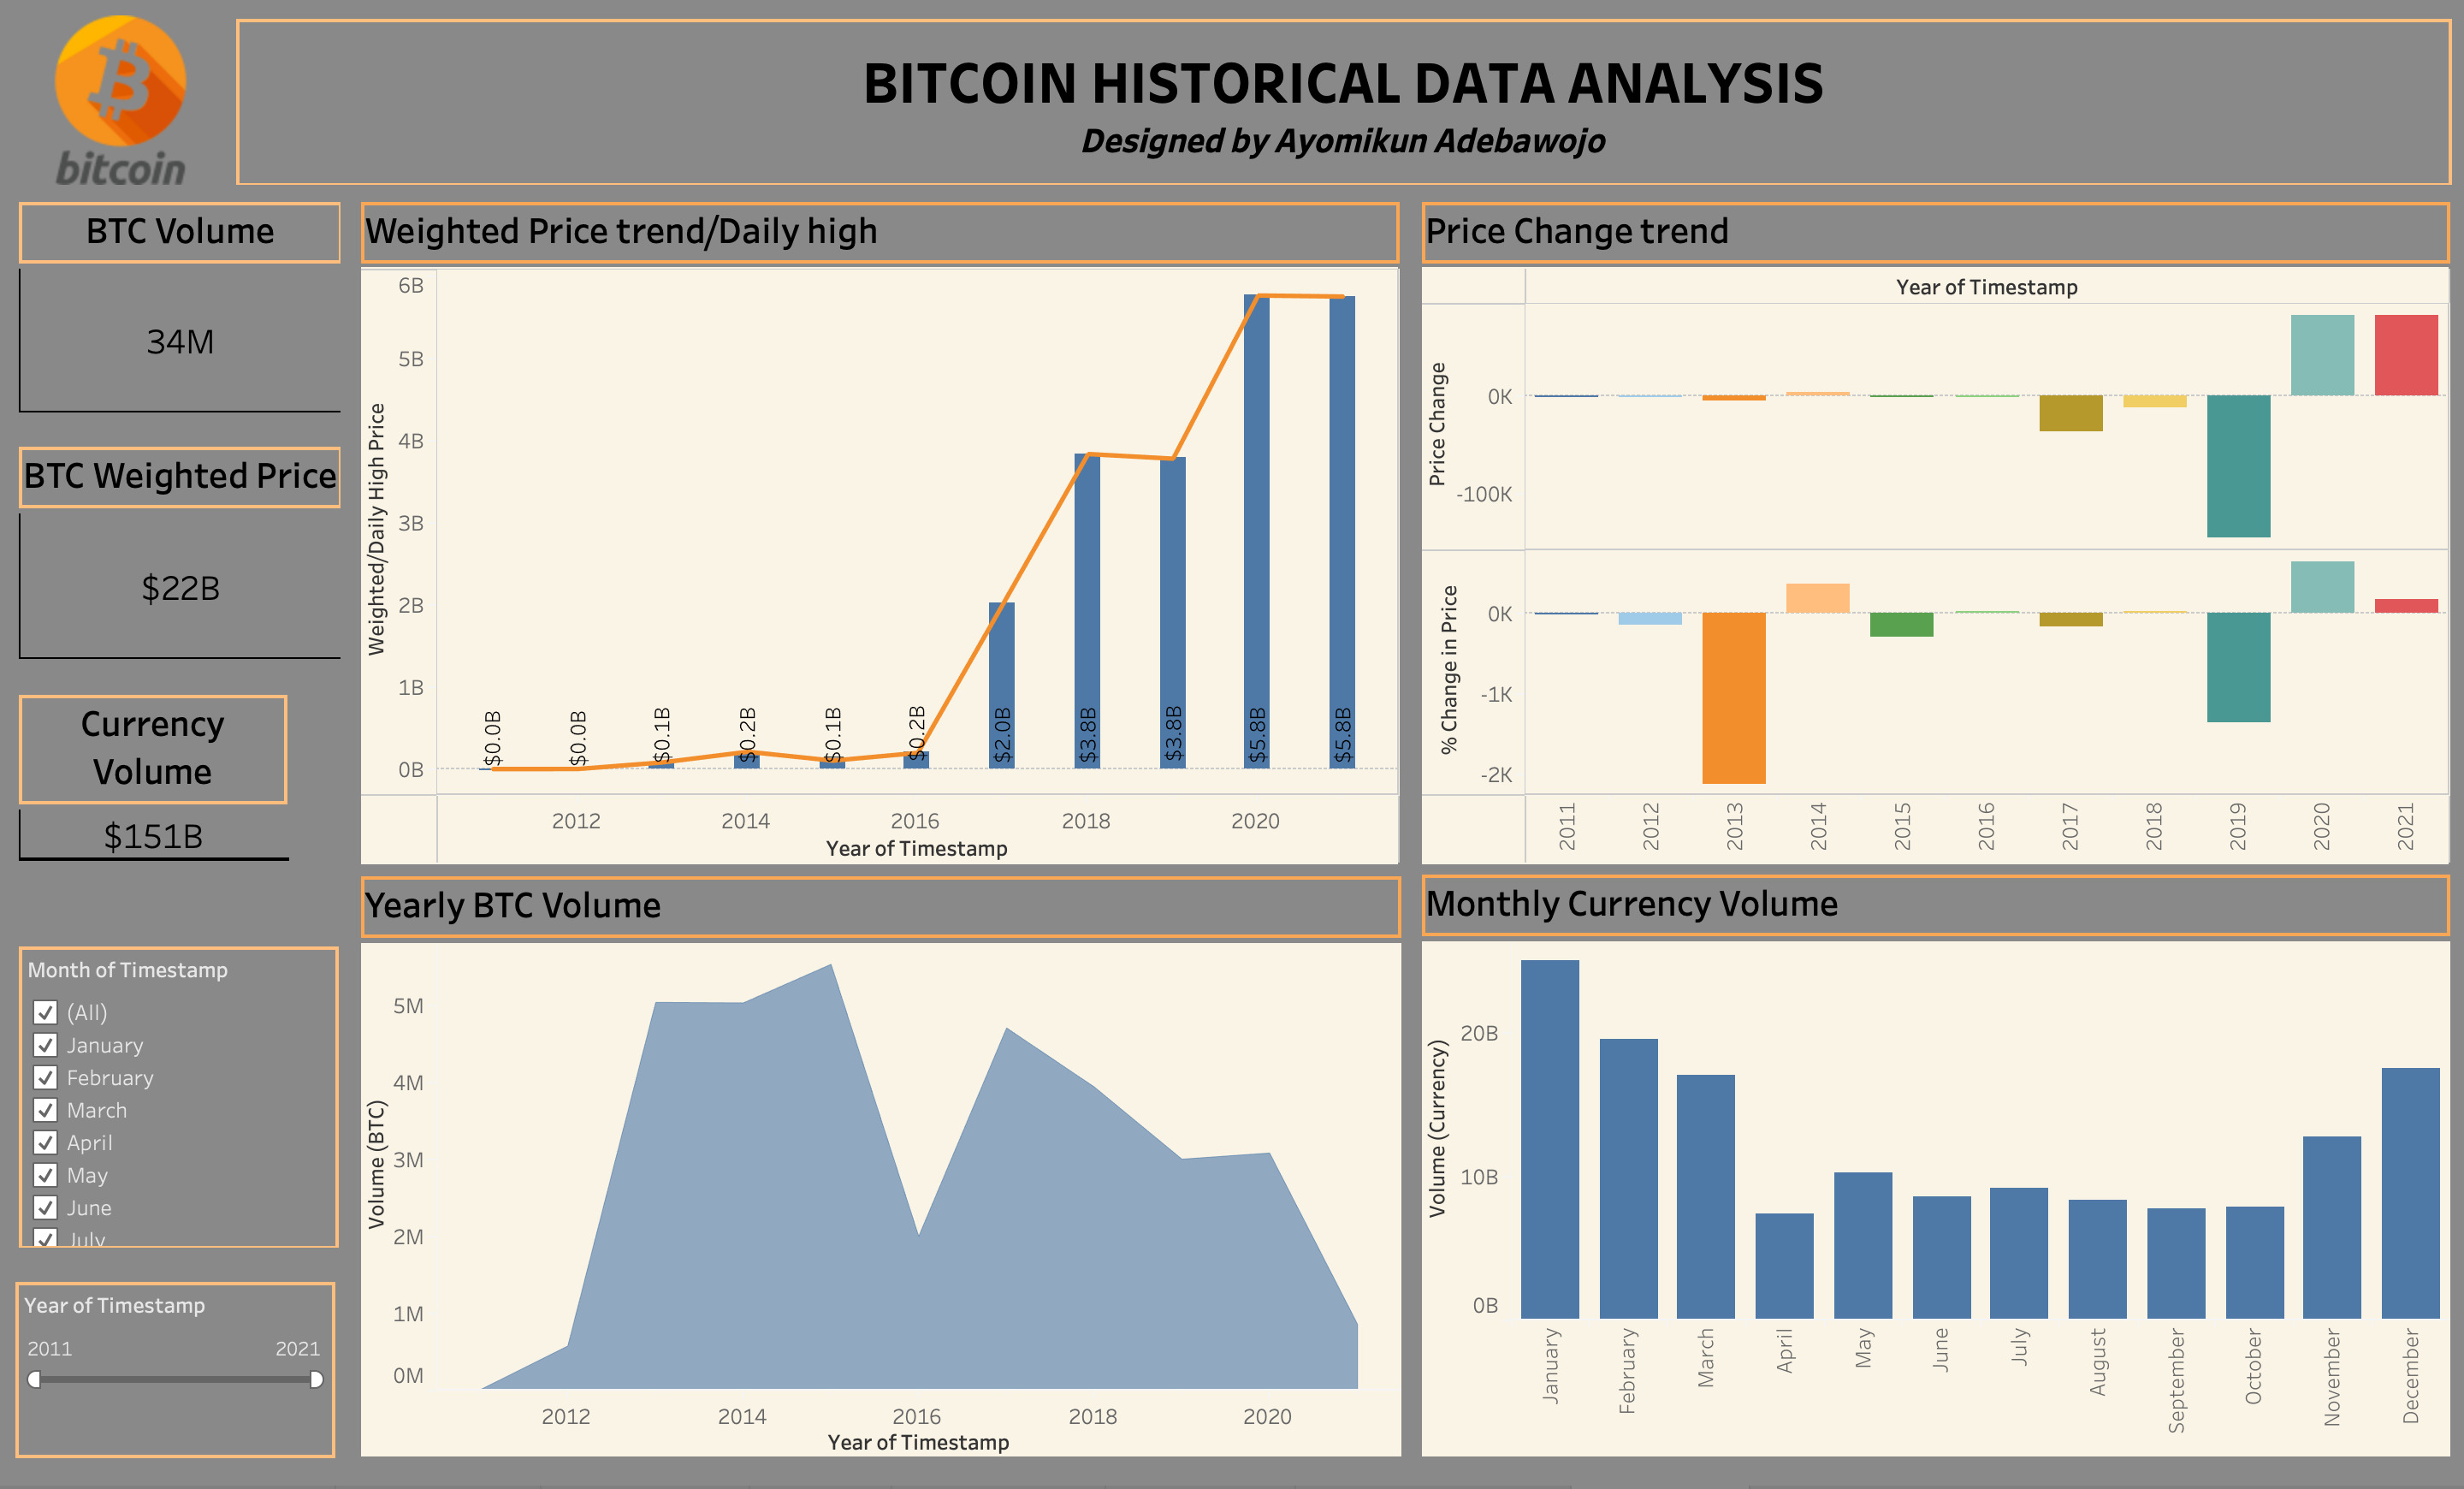
In this project, I analysed Bitcoin's historical data from 2011 to 2021, uncovering key trends in price surges, trading volume, and volatility spikes, especially post-halving events. Insights revealed that January sees the highest trading volume, while 2019 showed extreme volatility.
For investors, key recommendations include diversifying to manage volatility, monitoring market trends around halving events, and focusing on long-term growth while setting clear risk management strategies.